


Starting a small business is an exciting venture, filled with dreams of success and the desire for autonomy. However, the stark reality is that not all businesses survive the test of time. According to the U.S. Bureau of Labor Statistics (BLS), about 24.2% of U.S. businesses fail within their first year of operation. Understanding the factors contributing to these survival rates can help aspiring entrepreneurs prepare better and increase their chances of longevity in a competitive landscape.
Lendio looked at state and industry data to determine what factors can contribute to a business’s success or failure.
The statistics at a glance.
The statistics around small business survival can be sobering. Approximately 24.2% of private sector businesses in the U.S. fail within their first year of operation. Unfortunately, the trend does not improve much over time; after five years, nearly half—48.5%—have faltered, and after a decade, about 65.1% of businesses have closed their doors for good. These figures highlight the fiercely competitive environment small businesses face and the various challenges that can impact their viability.
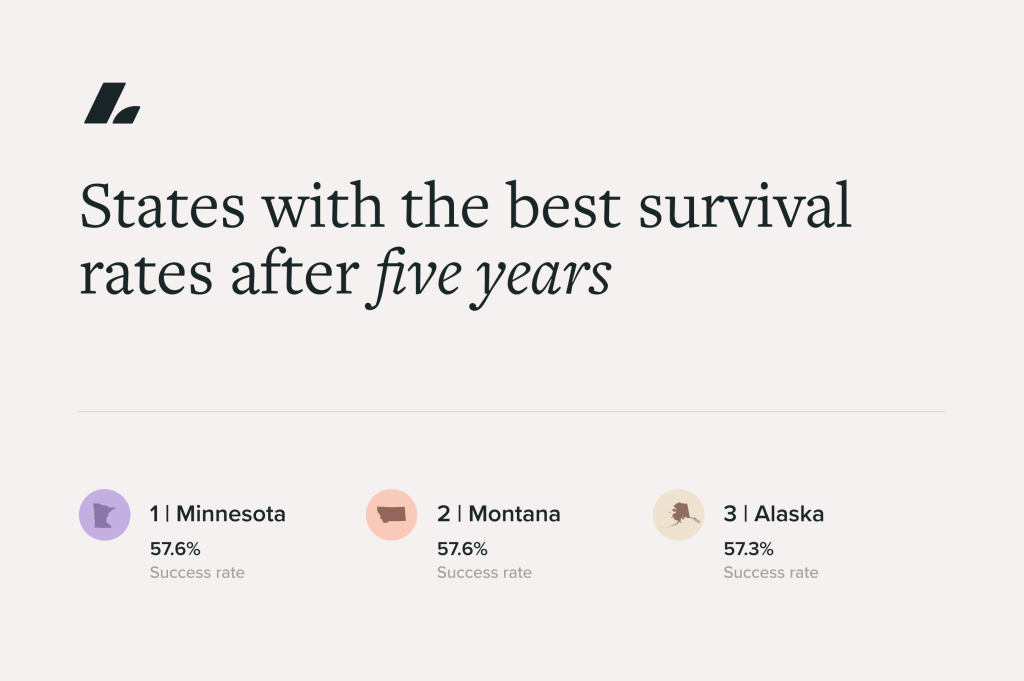
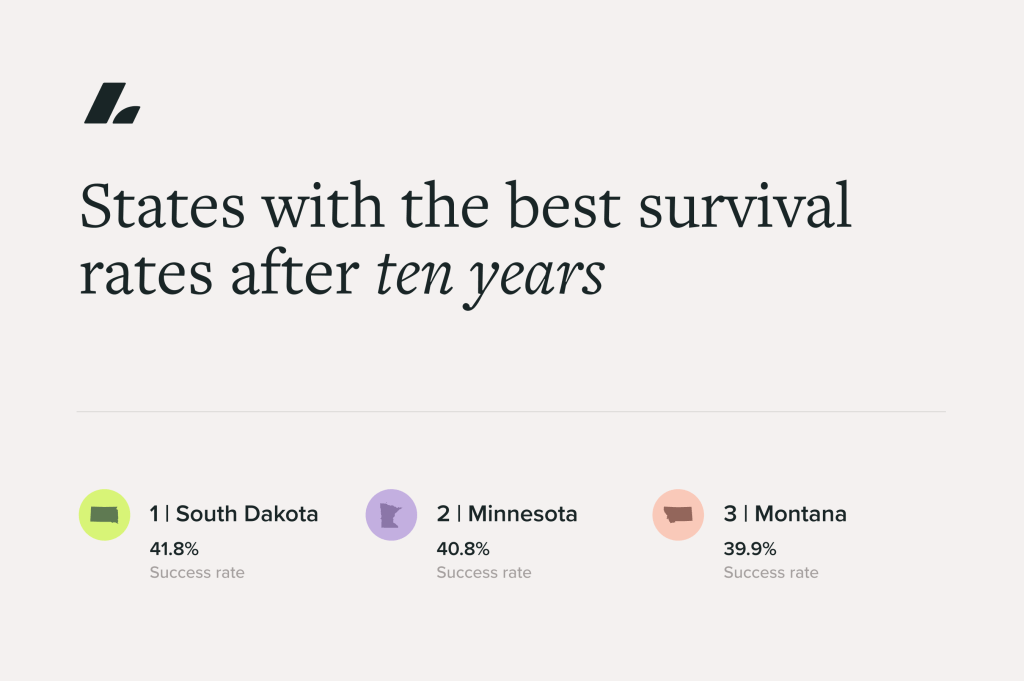
| State | Business failure rate within 1 year | Rank, 1-year failure rate | Business failure rate after 5 years | Rank, 5-year failure rate | Business failure rate after 10 years | Rank, 10-year failure rate |
|---|---|---|---|---|---|---|
| Alabama | 23.5% | 26 | 45.6% | 42 | 63.9% | 35 |
| Alaska | 27.3% | 6 | 42.7% | 49 | 60.7% | 48 |
| Arizona | 25.7% | 10 | 50.4% | 15 | 65.9% | 22 |
| Arkansas | 21.9% | 42 | 50.8% | 13 | 66.2% | 21 |
| California | 18.5% | 51 | 46.2% | 39 | 64.5% | 32 |
| Colorado | 23.8% | 22 | 50.1% | 17 | 66.5% | 16 |
| Connecticut | 25.2% | 16 | 48.9% | 26 | 67.0% | 11 |
| Delaware | 25.0% | 18 | 51.9% | 8 | 68.8% | 5 |
| District of Columbia | 32.2% | 2 | 58.1% | 1 | 70.8% | 2 |
| Florida | 22.6% | 37 | 49.2% | 23 | 65.5% | 23 |
| Georgia | 28.7% | 4 | 51.0% | 10 | 65.3% | 26 |
| Hawaii | 23.0% | 33 | 49.6% | 20 | 65.2% | 28 |
| Idaho | 30.7% | 3 | 52.2% | 6 | 66.5% | 16 |
| Illinois | 23.0% | 33 | 44.9% | 44 | 63.7% | 37 |
| Indiana | 23.0% | 33 | 46.9% | 36 | 61.4% | 44 |
| Iowa | 23.5% | 26 | 46.2% | 39 | 61.1% | 45 |
| Kansas | 26.2% | 7 | 53.5% | 4 | 67.1% | 10 |
| Kentucky | 18.8% | 50 | 47.8% | 30 | 62.7% | 39 |
| Louisiana | 23.6% | 25 | 47.2% | 33 | 65.0% | 30 |
| Maine | 24.0% | 20 | 46.8% | 38 | 62.5% | 41 |
| Maryland | 25.1% | 17 | 51.0% | 10 | 66.5% | 16 |
| Massachussetts | 19.2% | 49 | 43.3% | 47 | 61.1% | 45 |
| Michigan | 21.9% | 42 | 45.0% | 43 | 64.8% | 31 |
| Minnesota | 22.3% | 38 | 42.4% | 50 | 59.2% | 50 |
| Mississippi | 23.5% | 26 | 47.9% | 29 | 65.4% | 24 |
| Missouri | 25.4% | 13 | 55.4% | 2 | 69.3% | 4 |
| Montana | 26.1% | 8 | 42.4% | 50 | 60.1% | 49 |
| Nebraska | 23.2% | 21 | 49.1% | 24 | 69.7% | 3 |
| Nevada | 28.2% | 5 | 52.9% | 5 | 66.8% | 13 |
| New Hampshire | 25.3% | 15 | 54.0% | 3 | 66.3% | 20 |
| New Jersey | 21.4% | 45 | 50.5% | 14 | 66.8% | 13 |
| New Mexico | 25.7% | 10 | 51.9% | 8 | 68.3% | 6 |
| New York | 21.5% | 44 | 50.1% | 17 | 66.8% | 13 |
| North Carolina | 23.3% | 30 | 47.0% | 34 | 62.6% | 40 |
| North Dakota | 22.9% | 36 | 49.0% | 25 | 67.7% | 9 |
| Ohio | 23.8% | 22 | 47.0% | 34 | 61.0% | 47 |
| Oklahoma | 20.9% | 48 | 48.8% | 27 | 66.5% | 16 |
| Oregon | 25.6% | 12 | 47.8% | 30 | 61.6% | 43 |
| Pennsylvania | 21.3% | 47 | 45.8% | 41 | 65.2% | 28 |
| Rhode Island | 25.4% | 13 | 50.2% | 16 | 66.9% | 12 |
| South Carolina | 22.0% | 41 | 49.4% | 22 | 65.4% | 24 |
| South Dakota | 26.0% | 9 | 43.9% | 45 | 58.2% | 51 |
| Tennessee | 23.1% | 32 | 46.9% | 36 | 65.3% | 26 |
| Texas | 22.2% | 39 | 47.3% | 32 | 64.1% | 34 |
| Utah | 23.7% | 24 | 49.5% | 21 | 62.3% | 42 |
| Vermont | 24.6% | 19 | 49.7% | 19 | 64.2% | 33 |
| Virginia | 22.2% | 39 | 43.5% | 46 | 68.3% | 6 |
| Washington | 40.8% | 1 | 51.0% | 10 | 76.0% | 1 |
| West Virginia | 23.4% | 29 | 42.9% | 48 | 63.9% | 35 |
| Wisconsin | 21.4% | 45 | 48.1% | 28 | 63.2% | 38 |
| Wyoming | 23.9% | 21 | 52.0% | 7 | 68.0% | 8 |
| Average | 23.2% | 48.5% | 65.1% |
Geographic variations in failure rates.
Interestingly, there are notable geographical differences in business survival rates across the United States. Washington State has the highest business failure rate within the first year, with a staggering 40.8% of businesses not making it past this critical milestone. Following closely behind are the District of Columbia at 32.2% and Idaho at 30.7%.
On the contrary, California boasts the lowest business failure rate within the first year, with only 18.5% of businesses failing. Kentucky is just behind at 18.8%, and Massachusetts follows at 19.2%.
However, entrepreneurs should not let this data discourage them. A closer look at the data reveals that a significant number of locations exhibit below-average failure rates, indicating pockets of resilience among small businesses. Specifically, 32 out of the 51 locations examined for this piece boast lower-than-average one-year failure rates, suggesting that many entrepreneurs in these areas benefit from supportive ecosystems.
23 locations maintain below-average five-year failure rates, showcasing their ability to weather initial challenges and sustain growth over time.
Impressively, 24 of the locations also enjoy below-average ten-year failure rates, highlighting long-term viability and the significance of local conditions in nurturing successful business ventures.
The environment in which a business operates can significantly influence its chances of survival. In fact, according to a study by Lendio, environmental factors such as access to funding, tax incentives, and a flourishing local economy can significantly enhance business’s chances of survival and success in different states. By selecting a location that aligns with their business goals and provides the necessary resources, aspiring entrepreneurs can create a stronger foundation for long-term viability and growth.
Industry-specific challenges.
Beyond geographical factors, the industry in which a business operates also plays a crucial role in its survival.
Industries with lower survival rates
The transportation and warehousing industry is particularly challenging, with a failure rate of 24.8% within the first year. This figure is closely followed by the mining, quarrying, and oil and gas extraction industry at 24.4% and the information industry at 24.1%. These industries often face unique obstacles, from fluctuating demand to regulatory pressures, making it essential for entrepreneurs to understand the intricacies of their chosen field.
Industries with higher survival rates
Conversely, certain industries demonstrate significantly higher survival rates within their first year of operation. For instance, businesses in the retail trade sector have a low failure rate of just 12.9% in their first year. Similarly, the accommodation and food services industry shows a solid survival rate, with just 14.2% of businesses failing within their first year. The agriculture, forestry, fishing, and hunting industry also presents encouraging statistics with a failure rate of just 15.1%. These figures suggest that businesses in these industries may benefit from more stable demand or fewer operational hurdles, contributing to their advanced longevity.
When selecting an industry for a new business venture, it’s essential to consider not only the initial survival rates but also the long-term viability of that sector. While industries like retail and accommodation may show promising survival rates in their first year, it’s important to assess trends over a longer timeframe. For instance, the food industry, despite often having a solid start, can face challenges related to saturation, changing consumer preferences, and increasing competition, which might impact longevity. A comprehensive assessment of both short-term and long-term survival statistics will help entrepreneurs make informed decisions, ensuring they choose a path that not only offers immediate success but also sustainable growth in the years to come.
Recent trends and influencing factors.
It’s worth noting that the 1-year business failure rate has jumped by at least two percentage points for two consecutive years. This increase can be attributed to several factors, including various economic pressures. Businesses should be adaptable and resilient to help stay afloat during difficult times.
The business failure rates for the past three years are as follows:
- March 2020 – March 2021: 18.4% failure rate
- March 2021 – March 2022: 20.8% failure rate
- March 2022 – March 2023: 24.2% failure rate
Economic pressures can significantly influence a small business’s chance of survival, affecting everything from cash flow to consumer spending. During periods of inflation, for instance, the rising costs of materials and services can squeeze profit margins, ultimately making it harder for a business to stay afloat. When expenses increase, many small businesses are forced to make tough decisions, whether that means raising prices, cutting costs, or even reducing staff. These changes can directly impact customer satisfaction and loyalty, leading to a decline in sales.
Additionally, economic downturns can lead to reduced consumer confidence. When individuals are uncertain about their financial future, they are less likely to spend, which means businesses may experience a dip in sales. This is particularly challenging for startups or small businesses that rely heavily on consistent sales to sustain operations.
Additionally, access to financing becomes more difficult during economic struggles, as lenders tighten their criteria for loans. As a result, small businesses may find themselves grappling with insufficient working capital, making it a challenge to cover day-to-day operational costs or invest in growth opportunities. Understanding these economic dynamics is crucial for entrepreneurs aiming to enhance their resilience and sustainability in an unpredictable market.
Read the full article here